United States
Congressional districts drawn by an algorithm that knows nothing about politics.
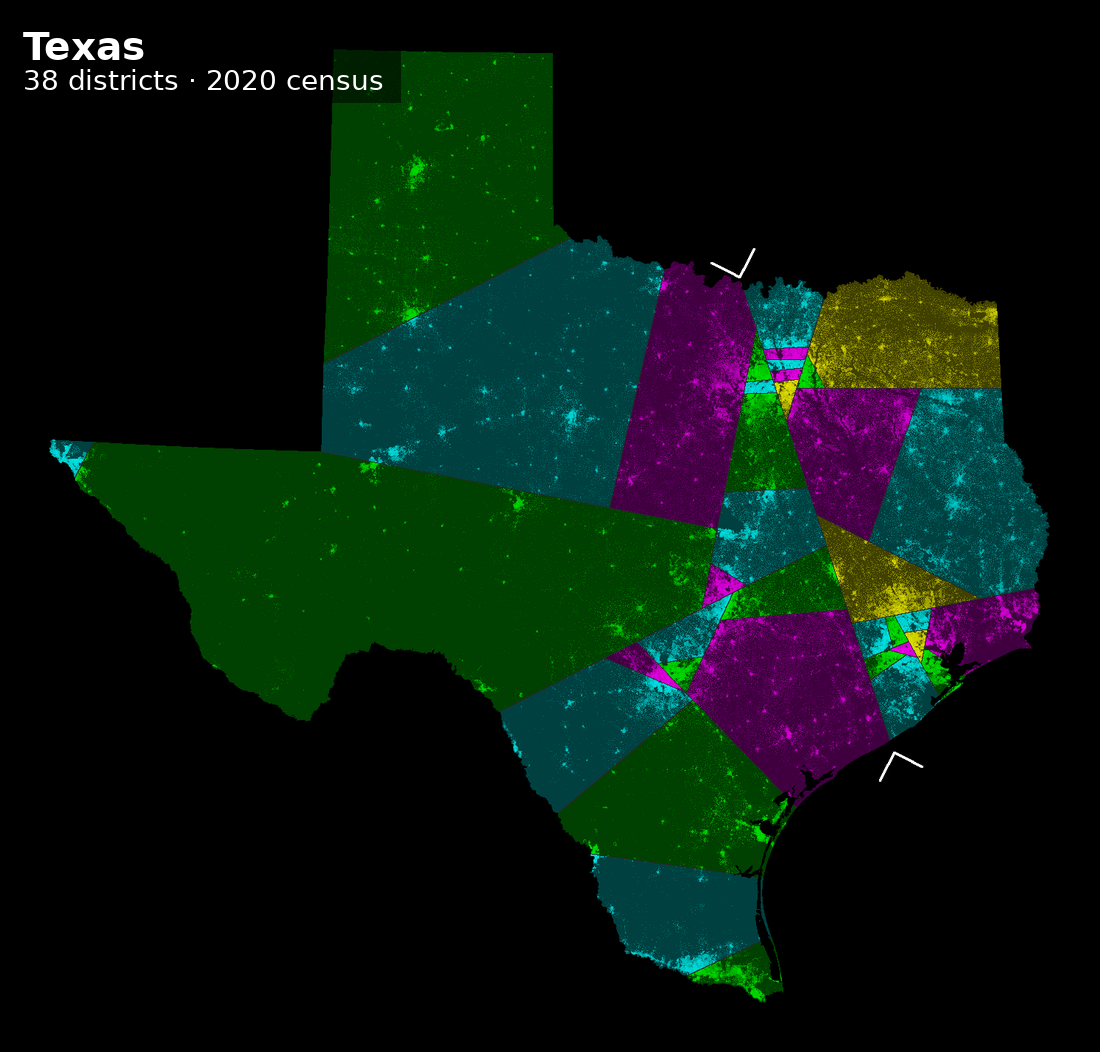
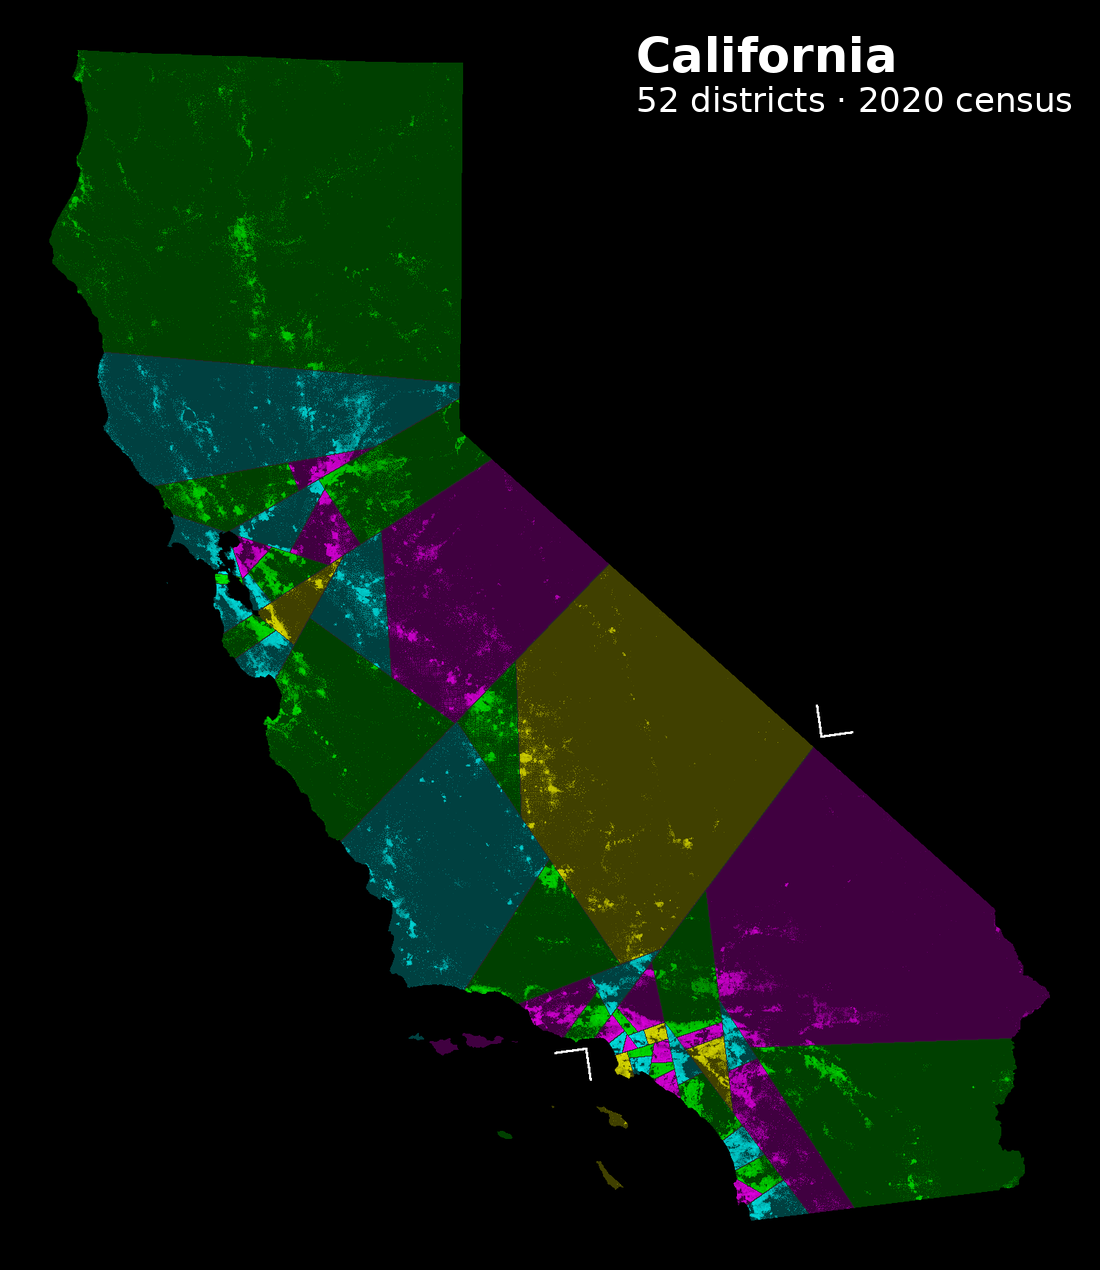
US congressional districts are drawn by state legislatures — the people who then run in them. The shortest splitline method removes every human decision: cut the state in two with the shortest straight line that leaves the right number of people on each side, then recurse. No communities of interest, no incumbents, no voting history. Just population and geometry.
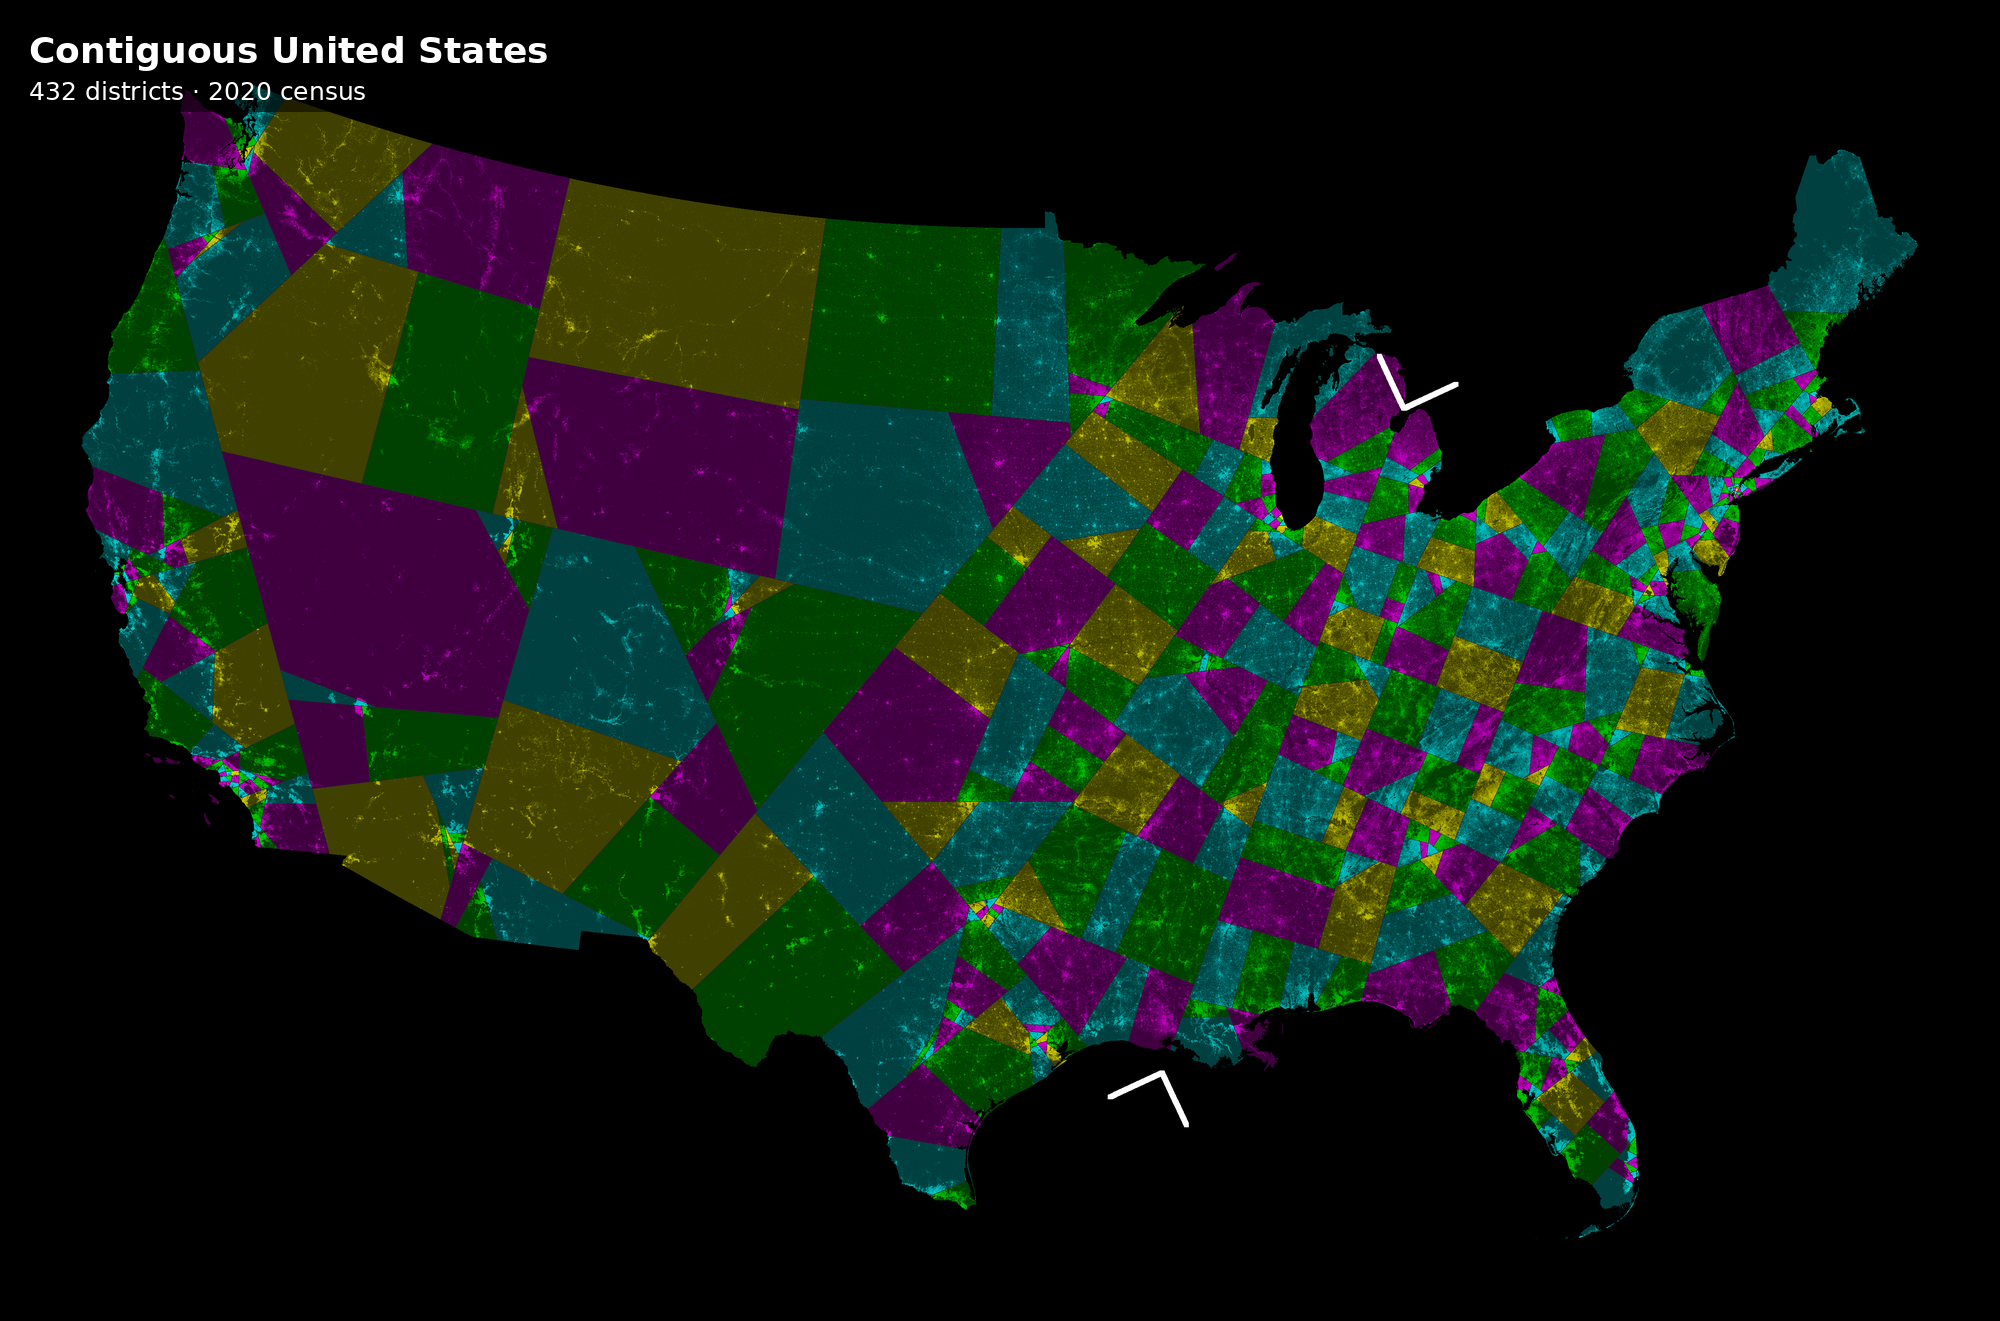
These maps are rebuilt from the 2000, 2010 and 2020 censuses — about 8 million census blocks per run. Brightness is population density, so the cities show up as the bright speckle.
The maps
The contiguous United States, 432 districts
One cut at a time
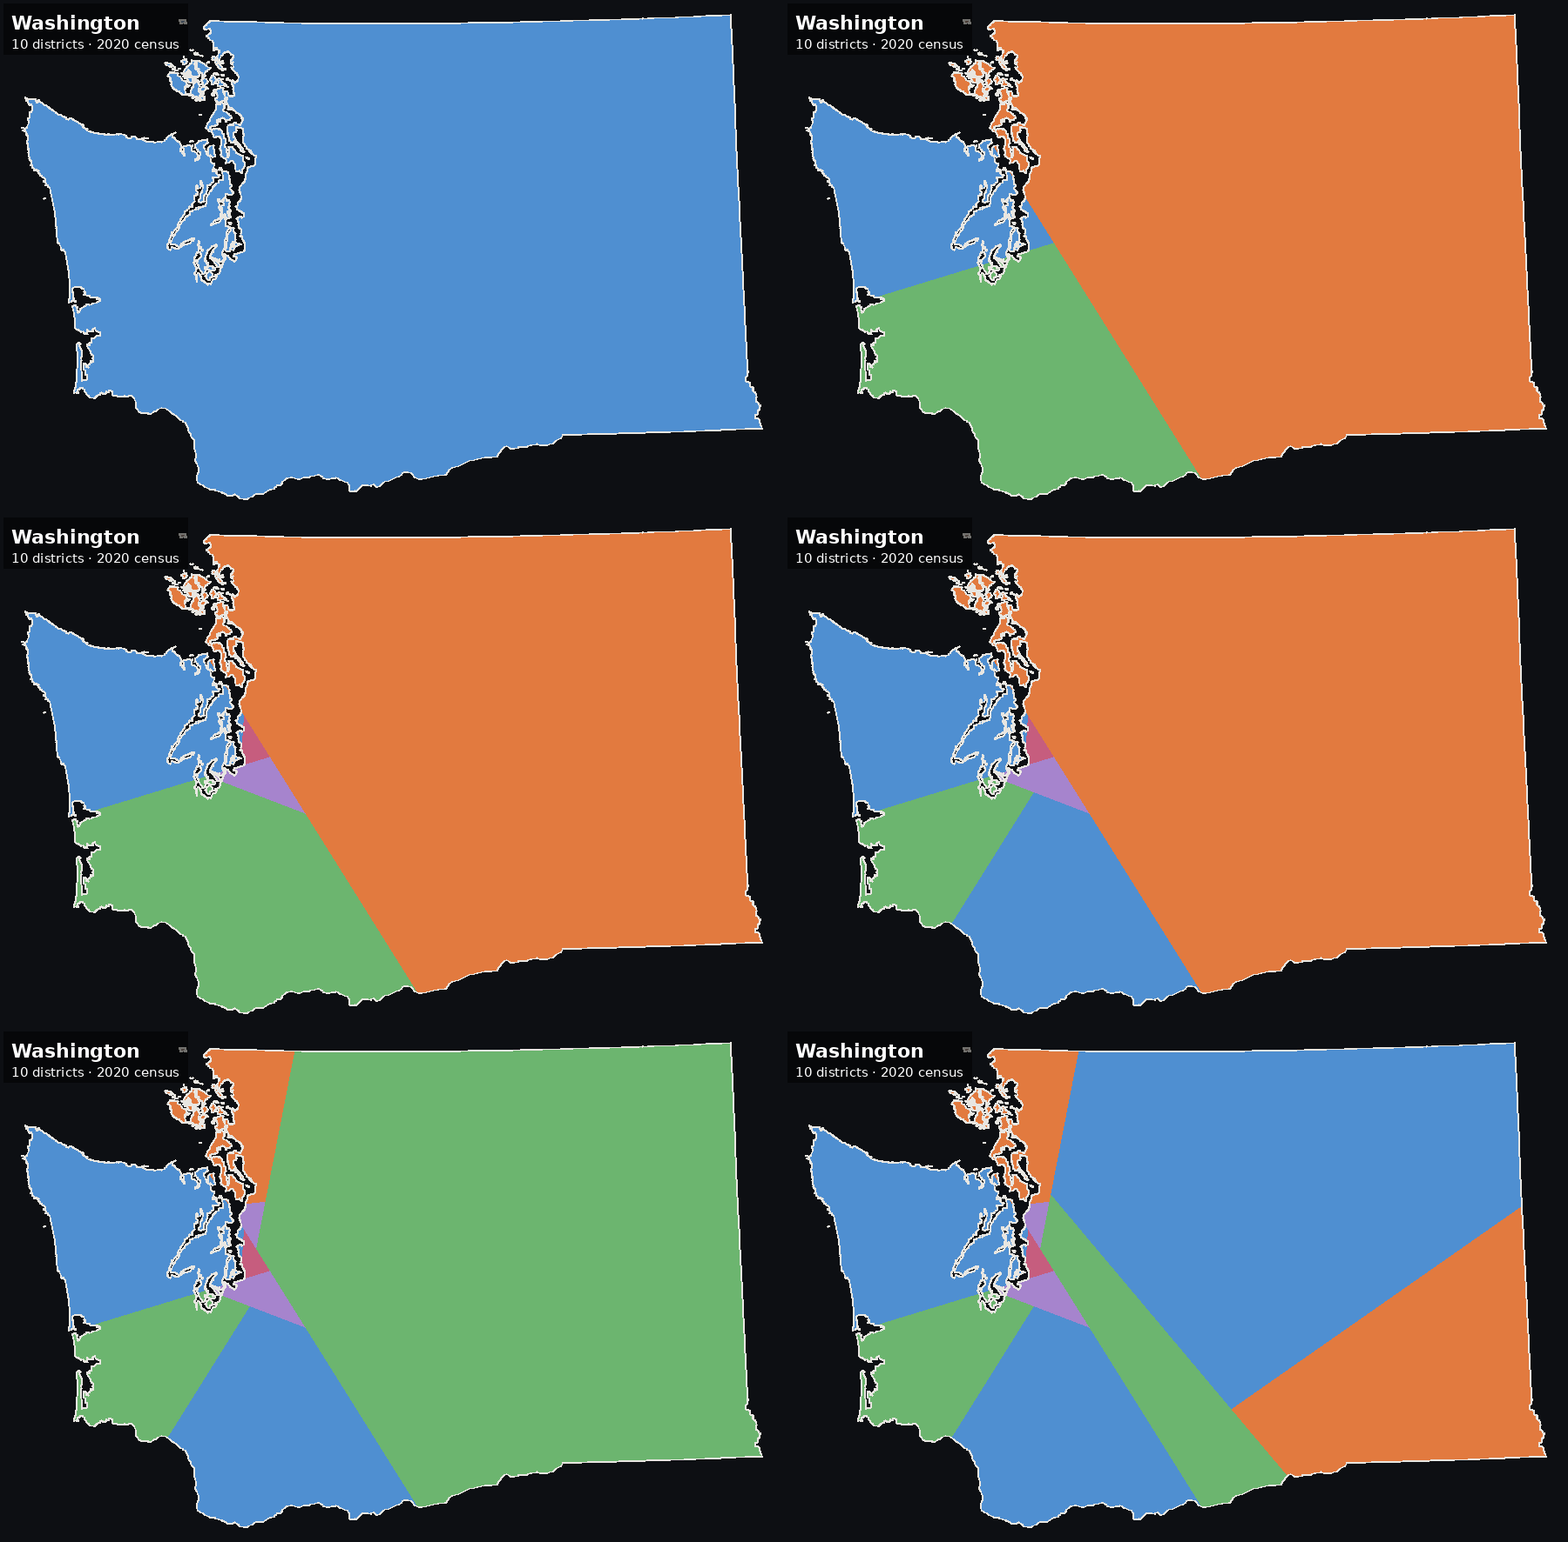
Every map is a binary tree of straight lines, so the whole thing can be replayed:

Does it reproduce the original?
The Center for Range Voting published splitline maps from the 2000 census in 2009. Rebuilding them from scratch is the test of whether any of this is right: same census, same seat count, same algorithm, independently written code.
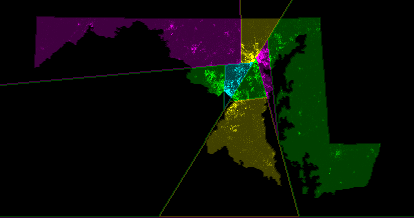
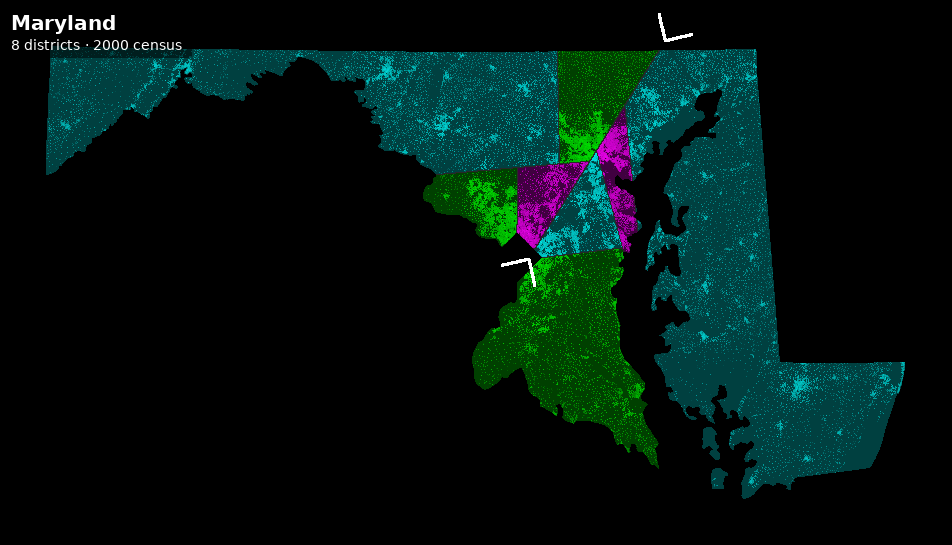
Overlaid, 99.6% of Maryland's land falls in the same district in both, and all eight districts correspond one to one, each overlapping between 97% and 100% of its counterpart. What disagreement is left is a single pixel wide and lies along the cut lines themselves — two renderers rounding the same boundary to opposite sides of a pixel, rather than any district actually being drawn differently.
A few states
What the maps change
A map is only interesting if you can score it. Each district of the splitline map and of the map actually in force is scored on the presidential vote cast in it, block by block — not the congressional vote, because block-level House returns barely exist. So these numbers measure the partisan balance of the ground a seat is drawn on, not who would have won the seat. In 2012 Obama carried 209 districts under the enacted map while Democrats won 201 seats; an eight-seat gap between those two things is normal.
Checked first: scoring the enacted map of the 113th Congress on 2012 presidential votes has to return exactly 209 D / 226 R, the published count of districts Obama carried. It does. A naive version of the same join — allocating each county's votes by population instead of by block — returns 239, a 30-seat error larger than the effect being measured.
Splitline removes about two thirds of the pro-Republican bias
“Bias” below is seat share minus vote share, in percentage points, positive for Democrats. Same votes, same states, same blocks; only the lines differ.
| Contest | D vote % | Enacted D | bias | Splitline D | bias | swing | control |
|---|---|---|---|---|---|---|---|
| 2012 president | 51.86 | 209 | −3.81 | 231 | +1.24 | +22 | R → D |
| 2016 president | 51.01 | 202 | −4.57 | 215 | −1.58 | +13 | R → R |
| 2020 president | 52.18 | 221 | −1.37 | 229 | +0.47 | +8 | D → D |
| 2016–20 composite | 51.68 | 215 | −2.26 | 221 | −0.88 | +6 | R → D |
That last figure matters more than it looks. The 65% was computed at one point in a space of modelling choices — how a block's population is spread over its area, and whether a cut's length counts the water it crosses. Rerunning the whole scoring at every available combination moves the answer between 63% and 65%, so the headline is the finding rather than the parameter.
One axis could not be tested, and saying so is the point of having a check at all. Varying the size of the House breaks the comparison: the seven states with no block-level election data published for them are exactly the states with a single district, which need none, and a bigger House gives them two. They then drop out of every map in the run including the enacted one, whose score moves although nothing about the enacted map has changed. Those runs are recorded as failures, not as results.
The interesting failure: 2016 does not flip
Democrats carried the 2016 two-party presidential vote 51.0–49.0 and would still have held only 215 of 435 districts under splitline — three short of a majority. Splitline moves 13 seats and that is not enough.
This is the result worth dwelling on, because it separates two explanations that are routinely conflated. The Democratic seat deficit is not purely a gerrymandering artifact. A large part of it is political geography: Democratic voters are concentrated in dense cities and win those districts with enormous margins, wasting votes, while Republican margins are spread more efficiently across suburbs and countryside. A compactness-maximising, party-blind rule cannot fix that, because the concentration is real and compact districts respect it.
So the honest summary is that redistricting reform recovers roughly two thirds of the measured bias, and the remaining third is geography, not cartography.
It is more compact, and where it is not is informative
Compactness is what splitline claims, so it should be measured rather than assumed. The measure here is the average distance from a resident to the centre of their own district, population-weighted — which is also Brian Olson's objective. It is used because it needs no district outlines: the enacted map arrives as a list of census blocks with no boundaries attached, so perimeter-based scores cannot be computed for the very map the comparison needs.
| State | Districts | Enacted | Splitline | Change |
|---|---|---|---|---|
| North Carolina | 13 | 50.0 km | 35.7 km | −28.6% |
| Pennsylvania | 18 | 35.7 km | 25.7 km | −28.1% |
| Texas | 36 | 57.3 km | 41.5 km | −27.6% |
| Illinois | 18 | 33.2 km | 26.6 km | −19.9% |
| Virginia | 11 | 47.6 km | 39.7 km | −16.5% |
| Washington | 10 | 36.7 km | 47.7 km | +29.7% |
The states where splitline wins biggest are the maps of the decade that were litigated, redrawn by courts, or both. The measure was chosen for being computable on both maps, not for detecting gerrymanders, and it finds them anyway.
Washington is the exception and it is not noise. Its enacted map was drawn by a bipartisan commission, so there was no gerrymander to undo; and its population sits in one dense strip along Puget Sound with a mountain range and an empty east behind it. A rule that cuts on the shortest straight line runs those cuts through the strip and pairs Seattle neighbourhoods with hundreds of kilometres of the Cascades, which a commission drawing to communities of interest will not do. Splitline beats a map drawn to win seats and loses to a map drawn to respect geography.
It is race-blind, and it is not race-neutral
This is the finding that cuts against everything above, and it is the largest effect on the page.
Voting-age population by race and Hispanic origin, from the census table that makes the categories mutually exclusive, over all 435 districts. Counts are districts in which the group exceeds the stated share.
| Group | National % | >50% enacted | >50% splitline | Change | 30–40% |
|---|---|---|---|---|---|
| Hispanic | 14.23 | 30 | 22 | −8 | 19 → 23 |
| non-Hispanic White | 67.04 | 338 | 346 | +8 | 32 → 30 |
| non-Hispanic Black | 11.57 | 22 | 5 | −17 | 11 → 26 |
| non-Hispanic Asian | 4.81 | 1 | 0 | −1 | 4 → 4 |
Black-majority districts fall from 22 to 5, a 77% reduction. Districts where Black voters are 30–40% of the voting-age population more than double, 11 to 26. The population is not disappearing; it is being spread across more districts in concentrations too small to elect a candidate of choice.
This is the mechanism the Voting Rights Act exists to prevent, and it is the predictable consequence of a rule that cuts on the shortest available straight line. Majority-minority districts are frequently non-compact by necessity — they follow a river, a rail corridor, a chain of neighbourhoods — and an algorithm blind to race by construction cannot see them.
These two findings are the same phenomenon seen from two sides. Majority-minority districts pack the most reliably Democratic voters in the country into a few seats won with 80% margins. Dissolving them is simultaneously why splitline gains Democrats seats and why it destroys Black descriptive representation. A reform that improves partisan proportionality by unpacking a party's most loyal constituency is not obviously a reform, and the trade-off should be stated in those terms rather than resolved by picking whichever metric flatters the conclusion.
Which votes the lines could have decided
Bias is a summary statistic; a roll call is an outcome. Every House vote from the 113th to the 117th Congress is screened for the two conditions that make it sensitive to the districting at all: it has to be close to the threshold that actually applied to it, and divided between the parties, since a vote both parties split evenly does not move when the composition does.
The threshold is not always a simple majority. A motion under suspension of the rules, or a veto override, needs two thirds — so one carried 290–140 fails, and measuring it against the other side's total would fill the shortlist with comfortable losses.
Each state's delegation is then resampled at constant size. This is where the US differs structurally from the other two countries here: apportionment fixes how many members a state sends, so splitline changes which districts it has and not how many. Where splitline gives one party k more districts in a state, k members of the other party are drawn out of that delegation and k are drawn in from that state's own members of the receiving party — with their votes, their defections and their absences.
| Congress | As elected | Difference | Counterfactual | Control | Reverse |
|---|---|---|---|---|---|
| 113th (2013–15) | 201 D / 234 R | +22 | 223 D / 212 R | R → D | 371 |
| 114th (2015–17) | 188 D / 247 R | +22 | 210 D / 225 R | R → R | 76 |
| 115th (2017–19) | 194 D / 241 R | +13 | 207 D / 228 R | R → R | 53 |
| 116th (2019–21) | 235 D / 200 R | +13 | 248 D / 187 R | D → D | 2 |
| 117th (2021–23) | 222 D / 213 R | +8 | 230 D / 205 R | D → D | 5 |
Almost three quarters of the movement is one Congress, and the reason is in the table rather than in the model: +22 seats is precisely what turns 201–234 into 223–212. Once control of the chamber changes, every party-line vote near the threshold goes with it — which is why 371 of 537 candidates reverse in the 113th and only 2 of 414 in the 116th, where Democrats already held the majority and the extra seats changed nothing that was close.
Among the reversals: the American Health Care Act, passed 217–213 in May 2017; the Agriculture and Nutrition Act of 2018, passed 213–211; the Student Success Act, passed 218–213; and in the other direction the 2014 Veterans' Access to Care Act, which failed 205–207.
A probability of 1.000 appears often, and it does not mean certainty. The only uncertainty modelled is which members sit and what they do — 22 seats against a two-vote margin swamps that. It is not behavioural uncertainty: the model assumes a member arriving in a redrawn district votes like their new party's other members from the same state, and that assumption comes with no error bar. Read these as “the seat arithmetic no longer supports this outcome”, not as a forecast.
Checked: the recomputed yes and no counts reproduce the published tallies on all 5,679 roll calls; seats by party reproduce the published composition of all five Congresses; and run with no seats moved, the resampling returns every recorded tally exactly and with zero variance, so the spread above comes from seats that moved rather than from the machinery.